Study Configuration Guide #
Studies in The Misinformation Game are configured through the use of Google Sheets spreadsheets. These spreadsheets contain all settings for your study in one place, including all images to be included in your study. This guide contains reference documentation for the configuration spreadsheet, alongside guides for its use.
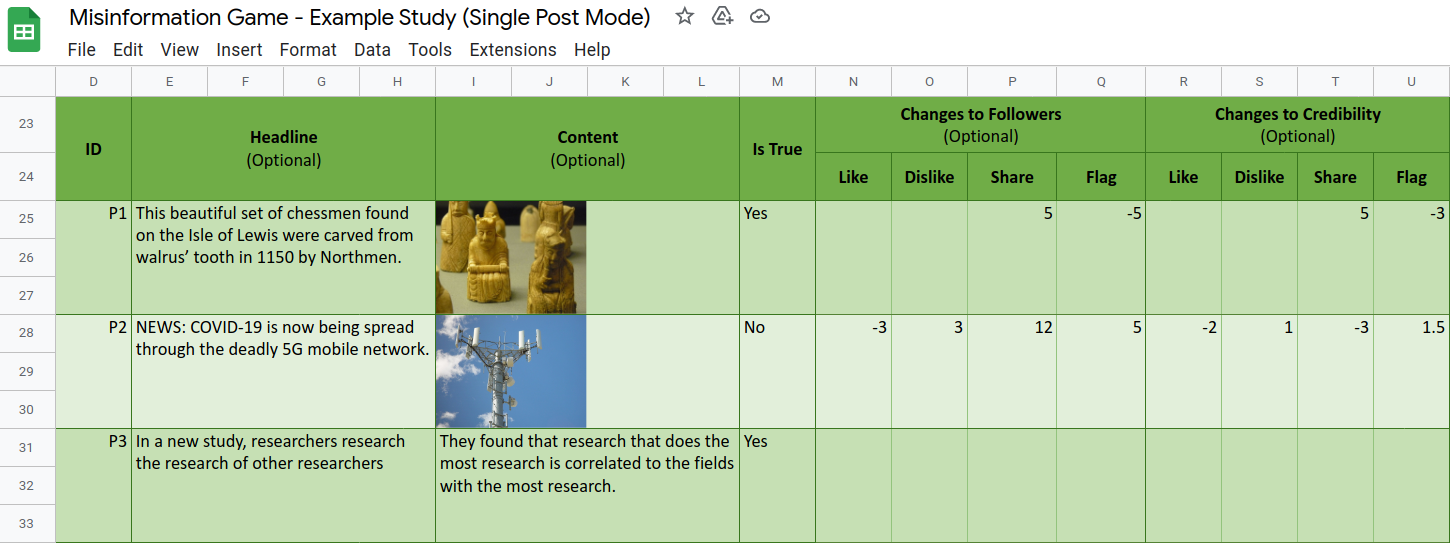
Table of Contents #
- Guide: Create a new Configuration Spreadsheet
- Guide: Upload your Study
- 1. About Worksheet
- 2. Overview Worksheet
- 3. General Worksheet
- 4. Pages Worksheet
- 5. Sources Worksheet
- 6. Posts Worksheet
- 7. Source & Post Selection Worksheet
- 8. Pre-Defined Source & Post Order Worksheet
Guide: Create a new Configuration Spreadsheet #
Before you can start configuring your study, you will first need to create a new spreadsheet for the study in Google Sheets. You can create a new spreadsheet by either copying the Study Template spreadsheet that is already on Google Sheets, or by uploading the Study Template file.
Important! The configuration spreadsheet
cannot
be opened in Microsoft Excel.
It is built specifically for use
in Google Sheets, and uses functionality that is not available in
Microsoft Excel.
Method 1: Copy the Template (Recommended) #
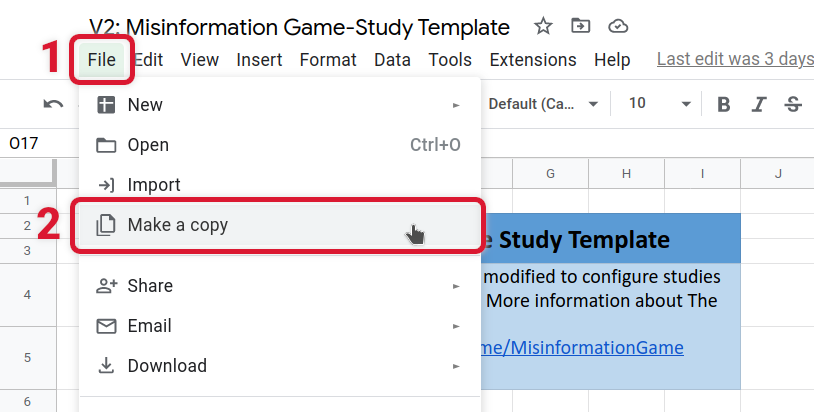
You can access the Study Configuration Template Spreadsheet from the study configuration template page. On this page, you should follow the latest recommended Google Sheets link. Once opened, select File -> Make a copy to clone the spreadsheet so that you can make your own study, as shown in Figure 1.
Method 2: Upload the Template #
You can download the Study Template file from StudyTemplate.xlsx. This file can then be uploaded to your Google Sheets using the following steps:
Step 1: Access Google Sheets at https://sheets.google.com.
Step 2: Select the Blank option to start a new spreadsheet.
Step 3: Select File -> Import -> Upload -> Select a file from your device.
Step 4: Use the file chooser to select the StudyTemplate.xlsx file that you downloaded to upload.
Step 5: Select the Import Location to be Replace spreadsheet.
Step 6: Click Import Data.
Your spreadsheet should now contain everything you need to create your new study.
Guide: Upload your Study #
Once you have completed configuring your study, it is recommended you first check the Overview sheet to make sure that everything looks correct, and doesn’t contain any errors.
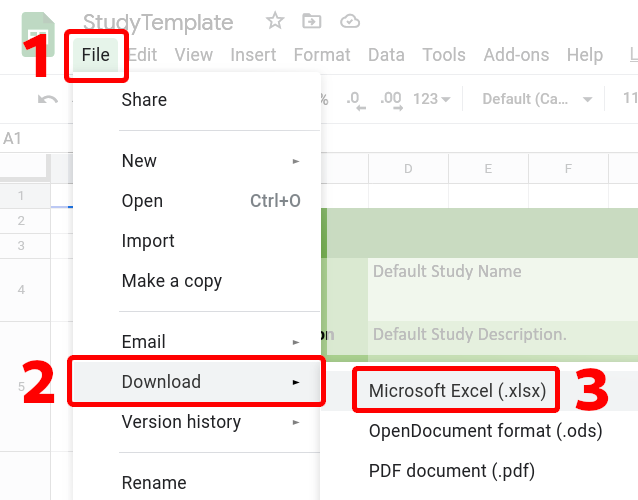
The configuration spreadsheet can then be downloaded as an .xlsx file to upload to The Misinformation Game. This can be done by selecting File -> Download -> Microsoft Excel (.xlsx). This process is shown in Figure 12. The name suggests that this spreadsheet is only meant for Microsoft Excel, but .xlsx is a general-purpose spreadsheet file format.
Once you have downloaded your study configuration as an .xlsx file, you can then upload it through The Misinformation Game admin dashboard by clicking the Upload New Study button. This will open a window where you can click Upload Spreadsheet to select the .xlsx file to upload.
If there are any errors that could be found with your study, then an error will be displayed in this window. Otherwise, a success message will be displayed, and you will be redirected to the admin view of your new study. You can then click the URL to your study at the top of its page to test it! Additional information about managing your study after you have uploaded it can be found in the Managing Studies documentation.
1. About Worksheet #
The About sheet gives an overview of the structure of the spreadsheet, with a short description of each sheet in the spreadsheet. It also contains a legend for what the different colour codes mean throughout the spreadsheet. The colour codes for cells are used to signify cells that should be edited, cells that are generated, and cells that you should read for help. Taking a look through the legend will help when reading the rest of the configuration spreadsheet.
2. Overview Worksheet #
The Overview sheet provides a summary of all the settings that have been entered. It also collates all the errors between all the sheets into one place, so that you can easily identify if there are any errors in your configuration.
Status #
(Overview > Status)
The status of the spreadsheet gives an indication of whether there are any errors in the spreadsheet. If there are any errors in any of the sheets, an error will be shown here.
Opened in Google Sheets #
(Overview > Opened in Google Sheets)
This attempts to detect whether the spreadsheet was opened in Google Sheets, and will error if it can detect that it was opened in Microsoft Excel. This detection uses a bug when converting between Google Sheets and Microsoft Excel, and it therefore may not be 100% accurate.
General Settings #
(Overview > General Settings)
This section gives an overview of the general settings of your study, as well as their validity in the top-left. The Pages value will show the exact order of pages that participants will be shown when they participate in your study.
Sources #
(Overview > Sources)
This will show the validity of all the sources you have entered, and includes the number of sources that have been included in the Sources sheet.
Posts #
(Overview > Posts)
This will show the validity of all posts, as well as the number of true and false posts that have been included in the Posts sheet.
If there are fewer true or false posts than the length of the study, a warning will be shown. This warning is shown as it is possible that the post selection will try to select a true post but fail due to having already shown all the true posts (depending on settings; see the Simulation documentation for details). The post selection will instead have to display a false post in this case. This could lead to a false post being shown, even if the true post percentage is 100%.
3. General Worksheet #
The General sheet is the best place to start when creating a study. It contains all the most broad settings of studies including their name, description, and length.
3.1. Basic Settings #
This section contains the most basic settings that likely should be changed for each study.
Name #
(General > Basic Settings > Name)
The name that is used for the browser tab title for participants in this study. This name is also used to identify the study in your admin dashboard.
Description #
(General > Basic Settings > Description)
The description of your study is used to include information about the study in your admin dashboard. This description is not shown to participants.
Prompt #
(General > Basic Settings > Prompt)
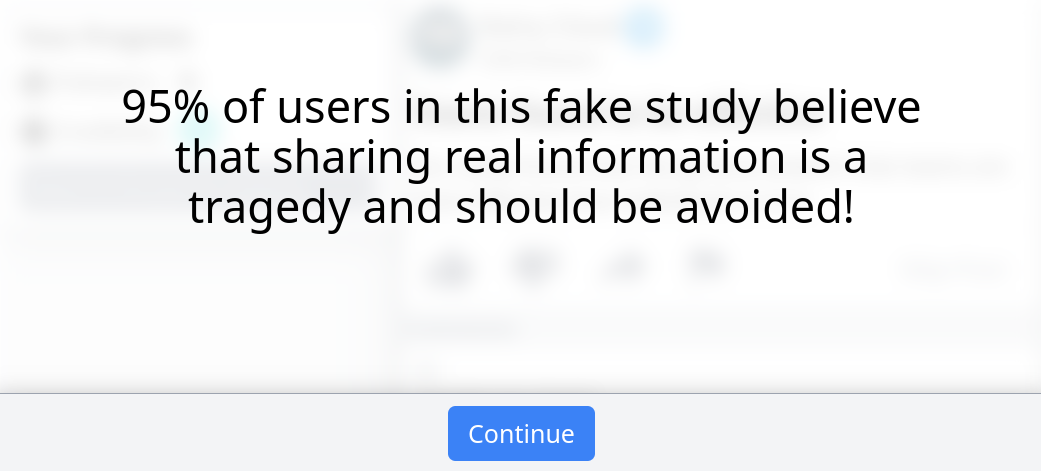
The prompt text to be shown to participants before they start the study. An example prompt is shown in Figure 2.
Length of Game #
(General > Basic Settings > Length of Game)
The exact number of posts to show to participants before they complete the study. The length of studies must be at least 1 post.
Require Reactions #
(General > Basic Settings > Require Reactions)
Whether participants are required to react to every post. Participants will still be able to skip posts, but to do so they will have to explicitly select “Skip Post” as their reaction (if it is enabled). This option is not available when posts are displayed in a feed.
Only available if:
Enable User Comments #
(General > Basic Settings > Enable User Comments)
Whether participants are required to comment on posts (“Required”), can comment on posts (“Optional”), or if commenting is disabled entirely (“Disabled”). Comments cannot be required when posts are displayed in a feed.
Require Participant Identification #
(General > Basic Settings > Require Participant Identification)
Whether participants will be required to provide a participant ID before starting the study. If this value is true, then participants will be shown an identification screen for them to manually enter their ID if it has not already been automatically populated from the URL they have been given. See Accessing the study URL for details on including a participant identifier in URL parameters.
3.2. User Interface Settings #
This section contains the settings that change the user interface of The Misinformation Game for participants. These options change the way that participants are able to interact with your study.
Display Posts in a Feed #
(General > User Interface Settings > Display Posts in a Feed)
Whether to display the posts to participants in a feed, instead of one at a time.
Display Followers #
(General > User Interface Settings > Display Followers)
Whether follower counts are shown to participants. The followers of sources and participants will still be simulated.
Display Credibility #
(General > User Interface Settings > Display Credibility)
Whether credibility ratings are shown to participants. The credibility of sources and participants will still be simulated.
Display Progress #
(General > User Interface Settings > Display Progress)
Whether to show participants their progress as a percentage (e.g. “55%”).
Display Number of Reactions #
(General > User Interface Settings > Display Number of Reactions)
Whether to show the ostensible number of prior reactions to posts and comments adjacent to the reaction buttons.
Allow Multiple Reactions at Once #
(General > User Interface Settings > Allow Multiple Reactions at Once)
Whether participants may select multiple reactions to a post or comment. For example, a user may choose to like and share a post if this is enabled.
Post Likes Enabled #
(General > User Interface Settings > Post Likes Enabled)
Whether to allow participants to like posts.
Post Dislikes Enabled #
(General > User Interface Settings > Post Dislikes Enabled)
Whether to allow participants to dislike posts.
Post Shares Enabled #
(General > User Interface Settings > Post Shares Enabled)
Whether to allow participants to share posts.
Post Flags Enabled #
(General > User Interface Settings > Post Flags Enabled)
Whether to allow participants to flag posts.
Post Skip Enabled #
(General > User Interface Settings > Post Skip Enabled)
Whether to allow participants to select an option to skip reacting to a post.
Only available if:
- General > Basic Settings > Require Reactions is "Yes".
- General > UI Settings > Display Posts in a Feed is "No".
Comment Likes Enabled #
(General > User Interface Settings > Comment Likes Enabled)
Whether to allow participants to like comments.
Comment Dislikes Enabled #
(General > User Interface Settings > Comment Dislikes Enabled)
Whether to allow participants to dislike comments.
3.3. Advanced Settings #
These settings can be used to fine-tune your study. It is unlikely that you will need to edit these settings.
Minimum Comment Length #
(General > Advanced Settings > Minimum Comment Length)
The minimum number of characters that participants must enter for their comments. The minimum length of comments must be at least 1 character.
Prompt Continue Delay (Seconds) #
(General > Advanced Settings > Prompt Continue Delay)
The period of time in which participants are not able to continue past the prompt page to start the game. This delay cannot be negative, but it can be zero.
Next Post Delay (Seconds) #
(General > Advanced Settings > Next Post Delay)
The period of time after the current post is shown in which participants are not able to continue to the next post. This delay cannot be negative, but it can be zero.
Only available if:
Generate Completion Code #
(General > Advanced Settings > Generate Completion Code)
Whether to generate and display a completion code to participants once they have completed the study. An example debriefing page that includes a generated completion code for a participant is shown in Figure 3.
Completion Code Digits #
(General > Advanced Settings > Completion Code Digits)
The number of digits to generate for the completion code (e.g. If this value is 4, then completion codes from 1000 to 9999 will be generated). The number of digits in completion codes must be at least 1.
Generate Random Default Avatars #
(General > Advanced Settings > Generate Random Default Avatars)
Whether to use a random background colour for the default source avatars. If set to “No”, the default avatars of sources will all have a white background. This setting does nothing if sources are given avatar images. The possible background colours when the background is randomised are shown in Figure 4.
4. Pages Worksheet #
The Pages sheet allows you to edit the content of the instructions and debriefing that the users may be shown. It also allows you to edit the enforced delays (with disabled continue button) on these pages.
4.1. Formatting the Text #
The text on these pages can be formatted to include bold, italic, larger text, smaller text, coloured text, or any other formatting that is available in Google Sheets. This formatting will be converted to HTML to be shown to participants. Your text can also be moved onto new lines by pressing Alt + Enter. This is equivalent to typing Enter in most text editors.
If there are not as many formatting options as you need, then you can also include HTML markup in the text.
If you include HTML in your pages, the formatting must be the same from the beginning of the HTML element to its end. If the formatting is inconsistent, then the formatting may interfere with the HTML you included. If you include a link, and it turns blue, then you will need to remove that link for the HTML to work as written. Links can be removed by placing your cursor over the blue link text, and clicking the unlink button.
Unfortunately, the Excel library we are using does not support the detection
of these blue links within cells. Therefore, links must be included through
the use of HTML <a> tags. For example, the HTML below creates a link
GitHub
that links to The Misinformation Game’s GitHub page,
<a href="https://github.com/TheMisinformationGame/MisinformationGame">
  GitHub
</a>
4.2. Available Pages #
Introduction before game rules #
(Pages > Introduction before game rules)
This page will be shown to participants after they have identified themselves, and before they are shown the rules of the game. This page can be used for instructions. It is optional, so if you do not wish to show participants an introduction before they are shown the game rules, then leave this page blank.
Game Rules #
(Pages > Game Rules)
This page will be shown to participants after they have viewed the introduction before the game rules page. This page is intended to be used to explain the rules of the game to participants. This page is optional, so if you do not wish to show participants any game rules, then leave this page blank.
The Game Rules page also supports several placeholders
to include icons and example UI elements in the page. The
placeholders can be included anywhere in this page’s content,
and they will be replaced by their corresponding UI elements
for participants. For example, if you type
{{LIKE}}
anywhere in the content of the page, then it will be replaced
by the like icon.
The only limitation is that the entire placeholder should have
the same formatting (e.g. font size, colour, and bold). If the
placeholder has inconsistent formatting, then it may not be
detected and replaced with the UI elements. For example, if
{{LI is bold, and
KE}} is not, the placeholder will not
be replaced.
The available placeholders are:
{{LIKE}}: The Like reaction icon.{{DISLIKE}}: The Dislike reaction icon.{{SHARE}}: The Share reaction icon.{{Flag}}: The Flag reaction icon.{{ENABLED-POST-REACTIONS}}: All the available reactions for posts displayed in a line, including Skip Post.{{ENABLED-COMMENT-REACTIONS}}: All the available reactions for comments displayed in a line.{{COMMENT-ENTRY-EXAMPLE}}: An example comment entry box for users submitting their own comments.{{YOUR-PROGRESS-EXAMPLE}}: An example Your Progress box with placeholder values.
Introduction after game rules #
(Pages > Introduction after game rules)
This page will be shown to participants after they have been shown the rules of the game. This page can also be used for instructions. It is optional, so if you do not wish to show participants an introduction after they are shown the game rules, then leave this page blank.
Debriefing #
(Pages > Debriefing)
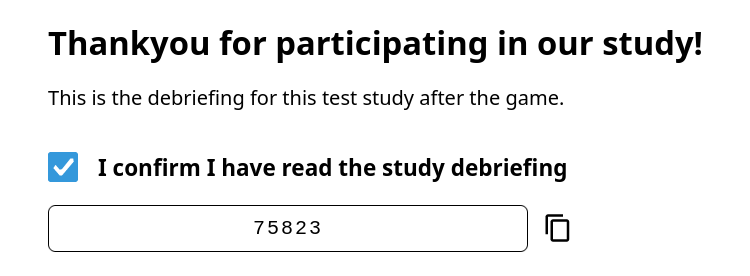
This page will be shown to participants after they have completed the study. This page is not optional. An example of this debriefing screen is shown below,
The Debriefing page also supports the placeholders
{{COMPLETION-CODE}} and
{{COMPLETION-CODE-WITH-CONFIRMATION}}
to include the completion code
of the participant in the page. Wherever one of the placeholders
is typed into the page’s contents, it will be replaced
by the completion code reveal widget.
The only limitation is that the entire placeholder should have
the same formatting (e.g. font size, colour, and bold). If the
placeholder has inconsistent formatting, then it may not be
detected and replaced with the UI elements. For example, if
{{COMPLETION is bold, and
-CODE}} is not, the placeholder will not
be replaced.
The optional -WITH-CONFIRMATION suffix for the completion code
will add a checkbox that will require participants to confirm
that they have read the study debriefing before they can copy
their completion code.
5. Sources Worksheet #
The Sources sheet allows you to add all the sources that can be shown to participants during your study. Each source contains several settings to define their appearance and behaviour. An example source for a post is shown in Figure 6.

The top of the sources sheet contains documentation about all the settings that can be defined for each source. To the right there is also a widget that can be used to preview the settings for your sources.
5.1. Default Source Values #
This section defines defaults for some source parameters to avoid repetition in entering values that are constant for most sources. If one of the parameters that has a default is not included for a specific source, the default value will be used instead.
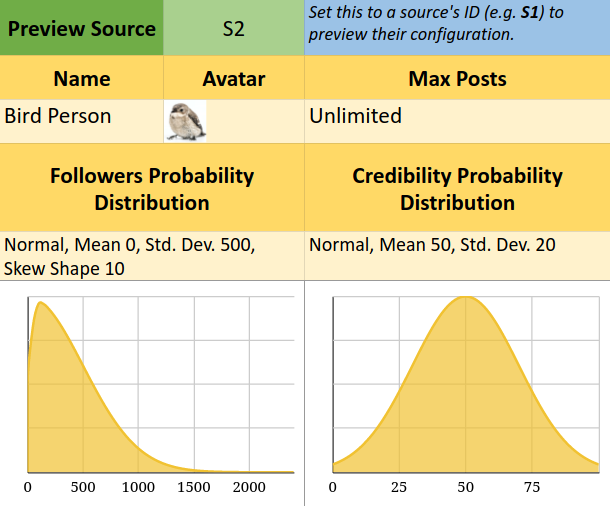
The Default Source Values allows you to define skew-normal distributions for the initial number of followers and credibility scores of sources. This random sampling of the initial number of followers and credibility for sources is not available on a per-source basis. The skew-normal distributions for the initial credibility and followers is configured by setting the mean, standard deviation, and skew shape of the distributions. These values are then used to sample the initial credibility and followers of sources from a skew-normal distribution with that mean, standard deviation, and skew shape when a new game is started. Each participant is likely to see different values chosen for sources that are sampled in this way.
The sampling of initial credibility values is truncated to between 0 and 100 credibility. The sampling of initial follower count values is also truncated such that source’s follower counts are never negative, and are always within 5 standard deviations of the mean. The 5 SD constraint is used to avoid random huge deviations from the expected distribution. The chances of a value being selected outside the mean +/- 5 SD is tiny (0.00006%), and therefore this should not affect the shape of the distributions noticeably.
An example preview of the distributions of the follower count and credibility for a source is shown in Figure 7.
5.2. Sources Table #
The table below the Default Source Values is where the sources in the study can be added. Each row in this table represents one source. The ID and Name of each source is required (although the ID should be pre-filled already). The remaining settings are optional, and if they are omitted the default settings are used instead. If an Avatar for a source is omitted, it will use a default based upon the Name of the source instead.
Source ID #
(Sources > Source ID)
The ID’s of sources are used to uniquely identify them. For example,
the ID of a source will be used to reference it in the results of
a study. The ID’s of the sources should be of the form Sx, where
x is an increasing integer (e.g. S1, S2, S3, etc…). In the
template sheet, all the IDs are already filled in, and you should not
have to edit them.
Name #
(Sources > Name)
The name of the source will be shown to participants when this source is used alongside a post.
Avatar #
(Sources > Avatar)
The avatar of a source is an optional image that is displayed in a circle alongside the source. If the avatar is not square, it will be cropped. The avatar images are only shown at small sizes, and therefore are recommended to have the dimension of 96⨯96 pixels. Recommendations for image file formats, downscaling your images, and compressing your images are all described in the Including Images in Studies documentation.
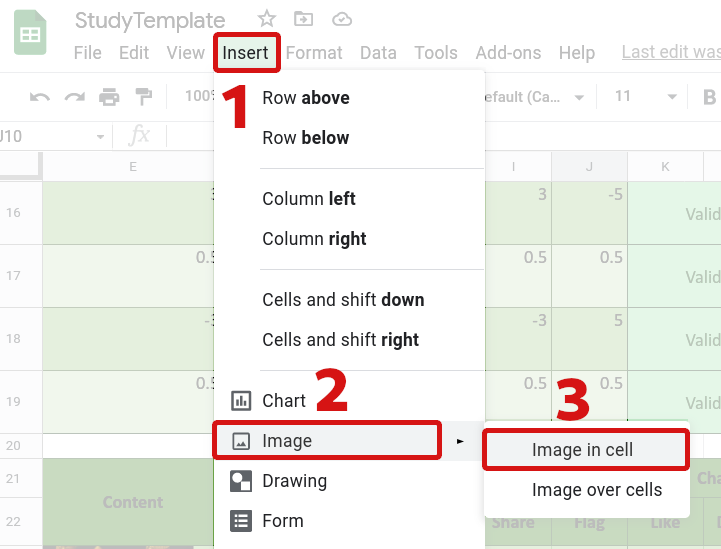
The avatar image must be inserted into the spreadsheet using the Insert menu at the top of the page on Google Sheets. You must first select the cell where you want to insert the avatar image, and then select Insert -> Image -> Image in cell. This process is highlighted in Figure 8. If you do not use this procedure, then The Misinformation Game may not be able to find the image to use for the avatar.
Max Posts #
(Sources > Max Posts)
The maximum posts for a source allows you to set a hard limit on the number
of times a source is shown to the participant. This value can either be an
integer greater than or equal to zero, or the text Unlimited to represent
that there is no maximum number of posts for this source.
The Max Posts value is also used to weight the random
selection of sources to be shown to participants. Sources
with a higher Max Posts value will have a higher chance of
being selected than sources with a low Max Posts value.
Sources with a Max Posts of Unlimited will be weighted
with the mean weighting of all sources with a Max Posts value.
Therefore, if you wish one source to show up more than others,
but do not wish to limit the number of times other sources can
be selected, you can use high values of Max Posts (e.g. a
source with Max Posts = 100 will be selected 10x more than a
source with Max Posts = 10).
Initial Followers #
(Sources > Initial Followers)
This optional value lets you set an exact initial follower count for this source. However, the actual follower count of the source may differ throughout participant’s games (see the Simulation page for details).
Only used if:
Initial Credibility #
(Sources > Initial Credibility)
This optional value lets you set an exact initial credibility number for this source. However, the actual credibility number of the source may differ throughout participant’s games (see the Simulation page for details).
Only used if:
True Post Percentage #
(Sources > True Post Percentage)
When using the Source-Ratios source/post selection method, this value is used to define the percentage of true posts that this source should show. After this source is selected, this will indicate the probability of it being paired a true post rather than a false post.
Only used if:
- Source & Post Selection > Method is "Source-Ratios".
6. Posts Worksheet #
The Posts sheet allows you to add all the posts that could be shown to participants during the game. Each post can only be shown to a participant once, and will never be repeated.
The top of the sheet contains documentation about all the settings that can be defined for each post. To the right there is also a table to display the total number of true and false posts that you have entered.
6.1. Default Post Values #
This section defines separate defaults for true posts and false posts. This is done to reduce the effort in creating consistent behaviour for true and false posts. For example, you could make sharing true posts increase credibility, and sharing false posts decrease credibility. The default values allow specification of normal distributions for the changes to participants’ followers and credibility after they like, dislike, share, or flag a post. There is also a default distribution for the number of reactions to display for likes, dislikes, shares, or flags for posts.
6.2. Posts Table #
The table below the Default Post Values allows you to enter all the posts that may be shown to participants during the study. Each row in the table represents one post. The ID, and the Is True columns are the only required columns for each post. However, one of Headline and/or Content must also be included. The remaining settings for changes to followers and credibility, and comments, are optional. If the changes to followers and credibility are omitted, the default settings will be used instead.
Post ID #
(Posts > Post ID)
The ID of each post is used to uniquely identify
the post. This ID should be of the form Px where x is
an increasing integer (e.g. P1, P2, P3, etc…). This ID
will be used in the results to refer to this specific post.
In the template sheet, all the IDs are already pre-filled,
and there should be no need to edit them.
Headline #
(Posts > Headline)
The headline of the post is used to provide a title above the content of the post. This headline is optional, and if it is not included then only the content of the post will be shown. The appearance of the headline within posts is highlighted in Figure 9.
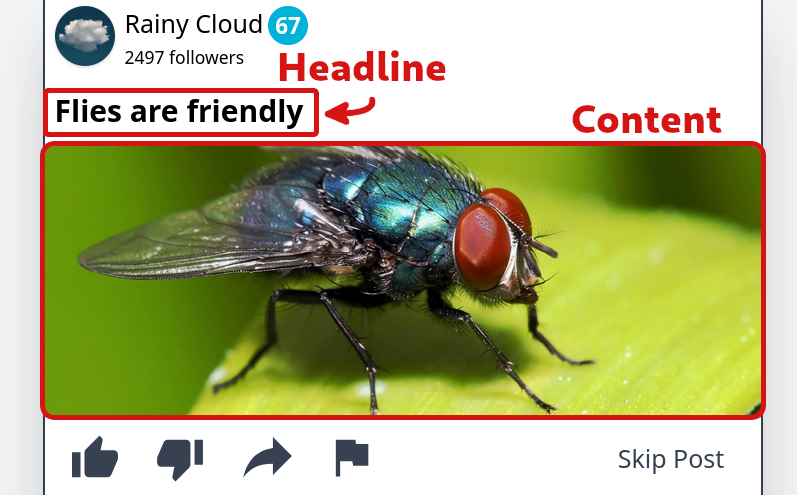
Content #
(Posts > Content)
The content of the post is used to provide a more substantial piece of text, or an image to display to participants. The content is optional, and if it is not included then only the headline of the post will be shown. The content can be either a piece of text or an image, but it cannot contain both.
If an image is used, then it is recommended to have a width of 600 pixels. For a typical landscape image, this would lead to an approximate dimensions of 600⨯340 pixels. Recommendations for image file formats, downscaling your images, and compressing your images are all described in the Including Images in Studies documentation.
Images must be inserted using the same procedure for inserting Avatar images into the spreadsheet. The content image must be inserted into the spreadsheet using the Insert menu at the top of the page on Google Sheets. You must first select the cell where you want to insert the content image, and then select Insert -> Image -> Image in cell. This process is highlighted in Figure 10. If you do not use this procedure, then The Misinformation Game may not be able to find the image to use for the content.
Is True #
(Posts > Is True)
This should be set to whether the post should be considered true or false. This value is used for the post selection, and for choosing the default settings to use for the post. This value is never shown to participants.
Changes to Followers #
(Posts > Changes to Followers)
These settings allow you to set the exact change to a participant’s followers after they like, dislike, share, or flag a post. This value can be a decimal number, however participant’s followers are rounded before being displayed. If this value is not provided for a particular post, the change is sampled from the default normal distribution instead.
Changes to Credibility #
(Posts > Changes to Credibility)
These settings allow you to set the exact change to a participant’s credibility after they like, dislike, share, or flag a post. This value can be a decimal number, however a participant’s credibility is rounded before being displayed. If this value is not provided for a particular post, the change is sampled from the default normal distribution instead.
Number of Reactions #
(Posts > Number of Reactions)
These settings allow you to set the ostensible number of prior reactions to display for each post. These numbers are displayed below the available reactions of the post or comment. If this value is not provided for a particular post, the change is sampled from the default normal distribution instead.
Only available if:
- General > UI Settings > Display Reaction Counts is "Yes".
- General > UI Settings > Post Likes/Dislikes/Shares/Flags Enabled is "Yes" for each specific reaction.
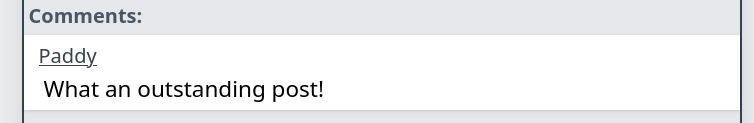
Comments #
(Posts > Comments)
Up to three optional comments can be configured for each post. Each comment must include both a Source Name and a Message, which are described below. An example comment is shown in Figure 11.
Comment Source Name #
(Posts > Comments > Source Name)
The name of the source to display as having made the comments.
Comment Message #
(Posts > Comments > Message)
The text to display as the content of the comments.
Comment Likes #
(Posts > Comments > Likes)
The number of likes to display for comments. These likes will only be shown if comments are enabled, comment likes are enabled, and displaying the number of reactions is enabled.
Only used if:
- General > UI Settings > Display Reaction Counts is true.
- General > UI Settings > Comment Likes Enabled is true.
Comment Dislikes #
(Posts > Comments > Dislikes)
The number of dislikes to display for comments.
Only used if:
- General > UI Settings > Display Reaction Counts is true.
- General > UI Settings > Comment Dislikes Enabled is true.
7. Source & Post Selection Worksheet #
The Source & Post Selection sheet allows you to edit the method that is used to select the source/post pairs that will be shown to participants in their games. There are four options for source/post selection: Overall-Ratio, Source-Ratios, Credibility, and Pre-Defined.
In-depth descriptions of each selection method are available in the Simulation documentation.
7.1. Selecting a Method #
The Source & Post Selection Method value at the top of this sheet should be changed manually to the name of the method to be used. This should be one of Overall-Ratio, Source-Ratios, Credibility, or Pre-Defined. Once you have entered your desired source/post selection method, the settings for all the other selection methods will be disabled.
7.2. Method 1: Overall-Ratio #
Sources will be selected randomly, and the associated post will be chosen to match an overall ratio of true:false posts. The settings for this method are available in the Overall-Ratio Settings section.
True Post Percentage #
(Source & Post Selection > Overall-Ratio Settings > True Post Percentage)
The percentage of true posts to display to users. This percentage is used to probabilistically sample posts. Therefore, the actual percentage for each participant will differ from this value. However, the percentage of true posts shown to all participants collectively should approach this value.
7.3. Method 2: Source-Ratios #
Sources will be selected randomly, and the associated post will be chosen to match the True Post Percentage defined for each source.
Similarly to Method 1, this does not guarantee that an exact percentage of true posts will be shown for each source in one game. However, over all games played, the actual percentage of true posts that a source is selected to show should approach their defined True Post Percentage.
7.4. Method 3: Credibility #
Sources will be selected randomly, and then a True Post Percentage will be calculated from the credibility of the source. The ratio will then be used to sample a true or false post to display alongside the source. The relationship between the source’s credibility and the true-post percentage to be used is a linear relationship. The parameters of the linear relationship between the two can be configured under the Credibility Settings section.
Linear Slope #
(Source & Post Selection > Credibility Settings > Linear Slope)
The increase in the True Post Percentage for every unit increase in a source’s credibility.
Linear Intercept #
(Source & Post Selection > Credibility Settings > Linear Intercept)
The True Post Percentage to use when a source’s credibility is zero.
7.5. Method 4: Pre-Defined #
An exact set of source/post pairs is manually defined to be presented to participants. The source/post pairs can be manually defined in the Pre-Defined Source & Post Order sheet, documented in the Pre-Defined Source & Post Order Worksheet section.
8. Pre-Defined Source & Post Order Worksheet #
This worksheet is only used if the Source & Post Selection Method is set to Pre-Defined. This worksheet contains a table of pre-defined source/post pairs to present to participants. The order that these pairs are presented may also be randomised.
Randomise Order #
(Pre-Defined Source & Post Order > Randomise Order)
Whether the presentation order of the pairs should be randomised. Otherwise, the pairs will be shown in the exact order specified, from top to bottom.
Source ID #
(Pre-Defined Source & Post Order > Source ID)
The ID of the source to be used for the post (e.g. S1). These IDs can be found in the Sources sheet.
Post ID #
(Pre-Defined Source & Post Order > Post ID)
The ID of the post to display (e.g. S1). These IDs can be found in the Posts sheet.
Back to Top