Getting Started with The Misinformation Game #
We have written this guide to help you get started with running your first study using the Misinformation Game! There are a lot of options available, so this guide will try to highlight the most important ones. You will be guided through the process of creating a study, configuring it, running it, and obtaining your results.
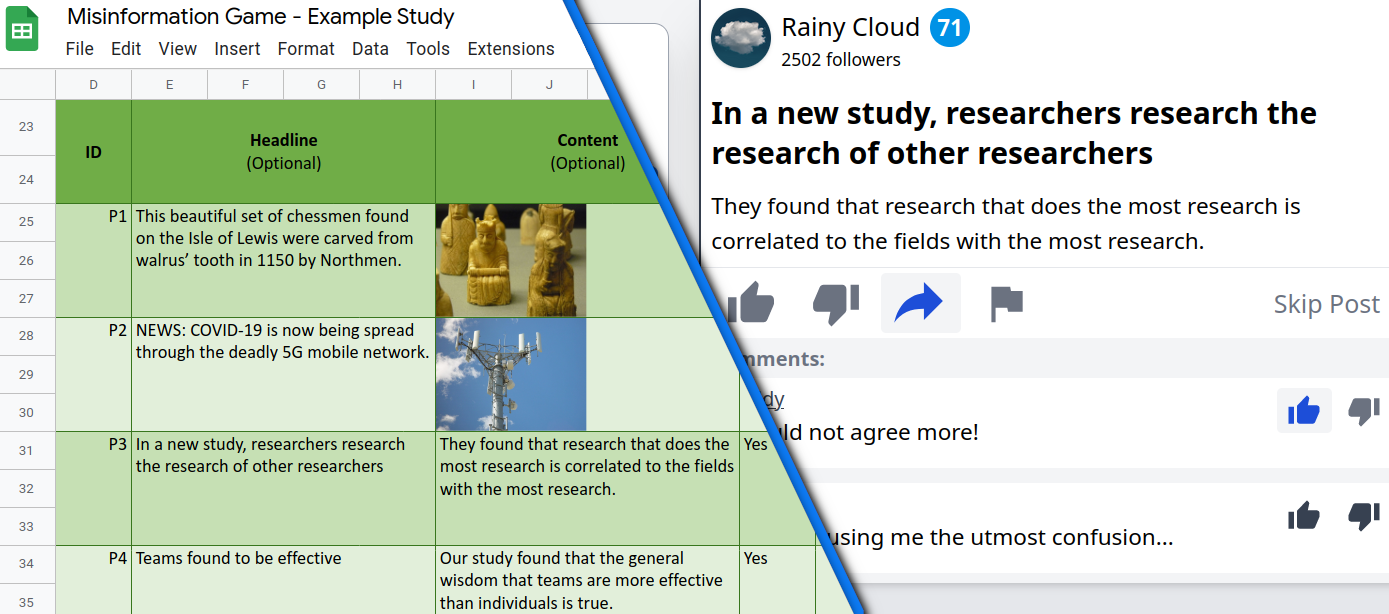
Table of Contents #
- 1. Copy the Study Configuration Spreadsheet
- 2. Create a Study
- 3. Install The Misinformation Game
- 4. Test your Study
- 5. Run your Study!
- 6. Learn about Future Updates 🚀
1. Copy the Study Configuration Spreadsheet #
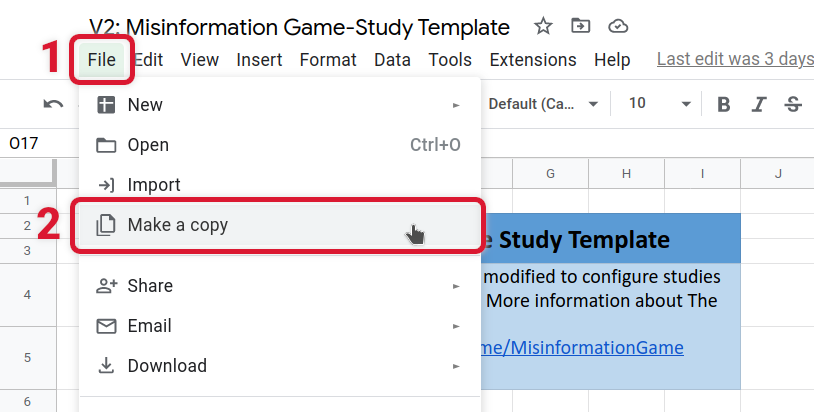
Before you can configure your study, you must first create your own copy of the Study Configuration Template in Google Sheets. This spreadsheet will hold all the settings of your study. You can access the template from the study configuration template page. On this page, you should follow the latest recommended Google Sheets link. Once opened, select File -> Make a copy to clone the spreadsheet, as shown in Figure 1. Your copy of the spreadsheet will now be linked to your Google account, and you may edit it to build your own study. More information about this process can be found in the Study Configuration guide. It is important to note that the configuration spreadsheet must be opened in Google Sheets. Excel is not supported.
2. Create a Study #
Studies are created by editing the configuration spreadsheet that you copied in section 2. All settings for your study will be kept in this spreadsheet, and this spreadsheet can be shared with others so that they can test or edit your study. Your study configurations may also be shared alongside your published works to aid with reproducibility.
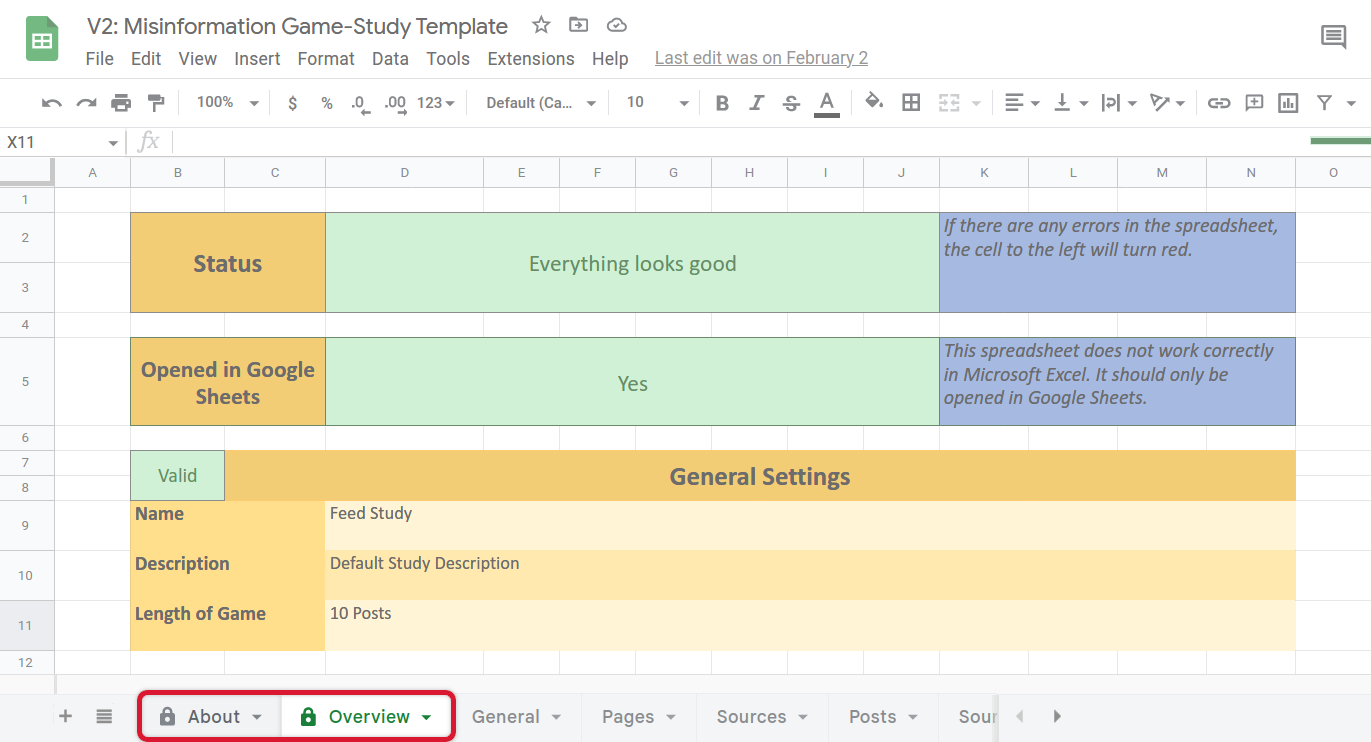
The first two sheets in the Google Sheets template, About and Overview, provide information about how to use the template, and an overview of the settings of your study as you create it. These sheets are highlighted in Figure 2. The Overview sheet can be useful to double-check the settings of your study before you test it, including checking if there are any errors with your configuration. These sheets are also locked, meaning you cannot (and should not) edit their contents.
2.1. Give your Study a Name #
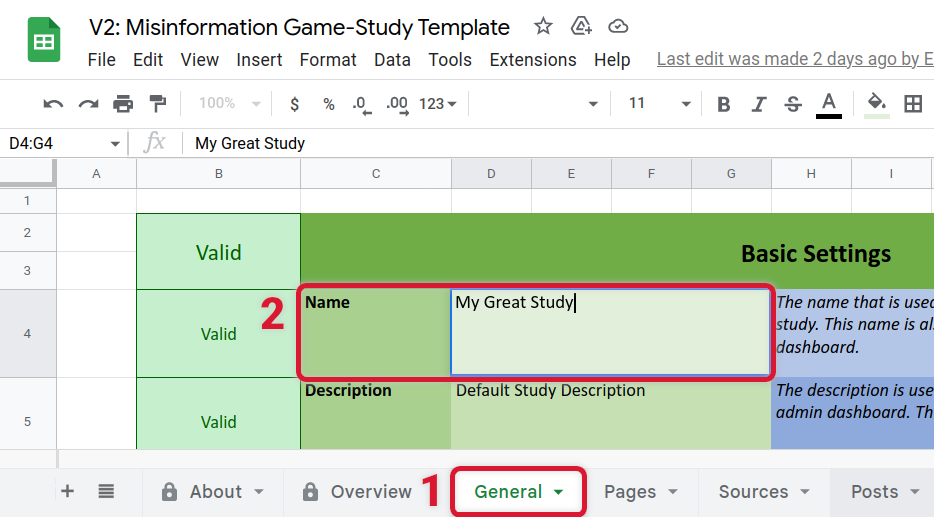
The first step to editing your configuration will be to give your study a name under the General sheet. This can be done by first accessing the General tab at the bottom of the spreadsheet, and then by editing the Name value, as shown in Figure 3. You should edit the cell to the right of the Name cell. This can be done by double-clicking the cell, deleting the default name, and typing in your unique study name. The value that you enter will be used as the name of your study. This may be used to identify your study, and will be visible to participants. Note that information entered into the Description cell is only visible to administrators, and so may be useful for including study information that should not be shown to participants.
This procedure for changing the name of your study by editing the value within a cell is also used for modifying almost all configuration options needed to create your study. However, some configuration options do require specific values to be entered. If this is the case, then the blue help cells for each configuration option will describe what you should enter. These help cells are often located to the right of the configuration input cells.
2.2. Add Sources and Posts #
The information presented to participants can take the form of text or image posts that are associated with sources. The sources may be used for many posts, but each post will only be shown once. An example source and post are highlighted in Figure 4. These sources and posts will form the primary information that is presented to participants.


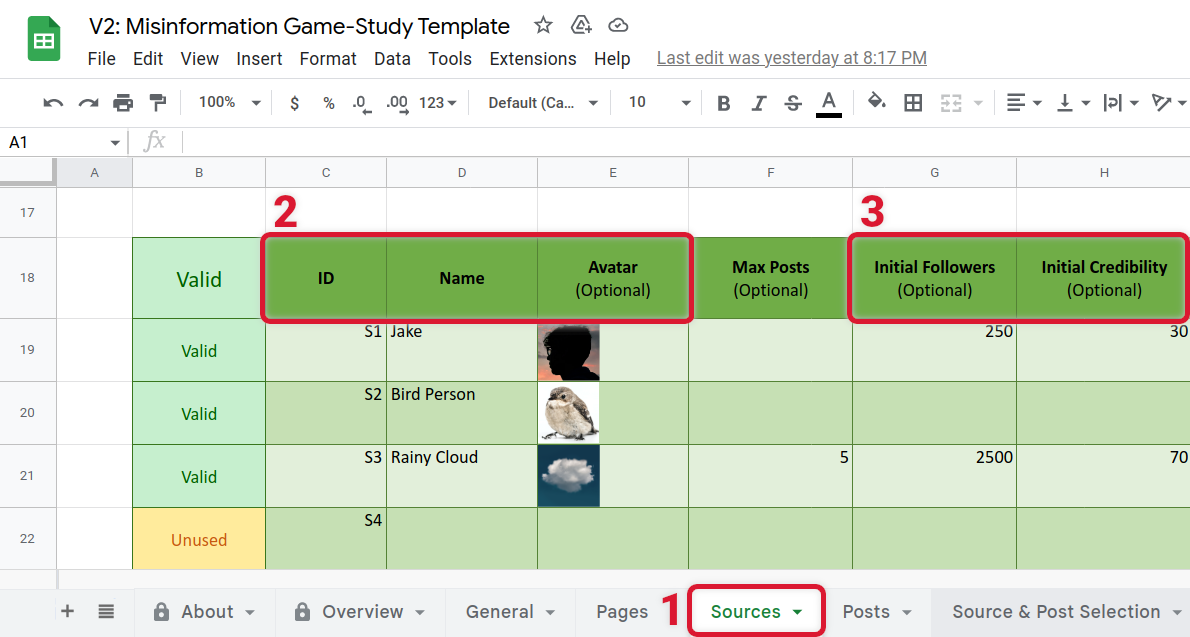
Sources are presented as the identity that published a post. Only the name of each source is required, but you may also choose each source’s avatar image, follower count, and credibility number. Sources for your study may be added by entering the necessary information into the table in the Sources sheet in your study configuration. The columns to enter values in are highlighted in Figure 5. Additional documentation about the available configuration options for sources can be found in the Sources configuration reference.
The posts that you add may include a headline, and either text or image (including gifs) content. Posts must include at least a headline or content, but both are not required. Additionally, you must specify whether the post is true or false. This value is used for selecting default values for posts (e.g., quantity of engagements associated with the post) and for associating posts with sources. Therefore, it is only used internally, and may be used to represent information other than truth for your study. For example, if you are creating a study to test whether including highly emotive images in posts affects the reactions of participants, you may use this field to store whether a highly emotive image is or is not included.
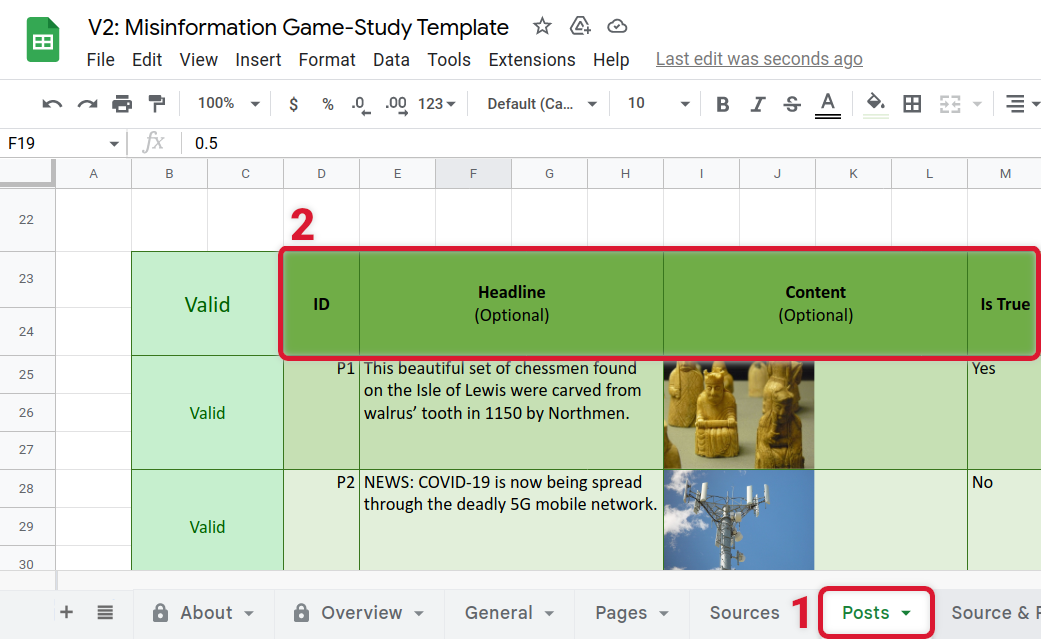
The posts for your study may be added by entering information into a row in the table in the Posts sheet in your study configuration. The columns to enter values in are highlighted in Figure 6. Images may be included for the content of posts by selecting Insert -> Image -> Insert image in cell in the top menu. However, it is important that any images that you add are optimised to reduce your hosting costs. See the guide for including images for recommendations. Additional documentation on the available configuration options for posts can be found in the Posts configuration reference. For example, you may include additional comments on each post, as described in the Posts comments documentation.
2.3. Configure Reactions and Comments #
The responses from participants can take the form of reactions to posts, or comments on them. Examples of reacting to, and commenting on, a post are shown in Figure 7. There are many options to configure the available responses for your participants, which can be set within the General sheet. You should select the options that are most applicable for your research. The major available options are listed below:
- You may enable or disable the available reactions for posts and comments (see Post Likes Enabled).
- You may set reactions to be required or optional (see Require Reactions).
- You may set comments to be required, optional, or disabled (see Enable User Comments).
- You may set whether multiple reactions to posts and comments is possible (see Allow Multiple Reactions).
- You may set whether reaction counts should be displayed below the reactions (see Display Reaction Counts).


2.4. Control Dynamic Feedback #
The dynamic feedback changes the follower count and credibility score of participants based upon their reactions to a post. These changes can be chosen by you for each post. An example of the follower count and credibility number of a participant changing is shown in Figure 8. If you wish, you may also disable followers and/or credibility from being shown to participants at all (see the Display Followers configuration).
There are two major options to configure the dynamic feedback that participants receive: you can specify default normal distributions to sample the changes from, or you can override these distributions to specify exact changes for each post. These changes are configured for each reaction separately (e.g., like, dislike, share, or flag). Additionally, they only apply when reacting to a post, not its comments. If a participant selects multiple reactions, then the changes for each reaction will be added together.
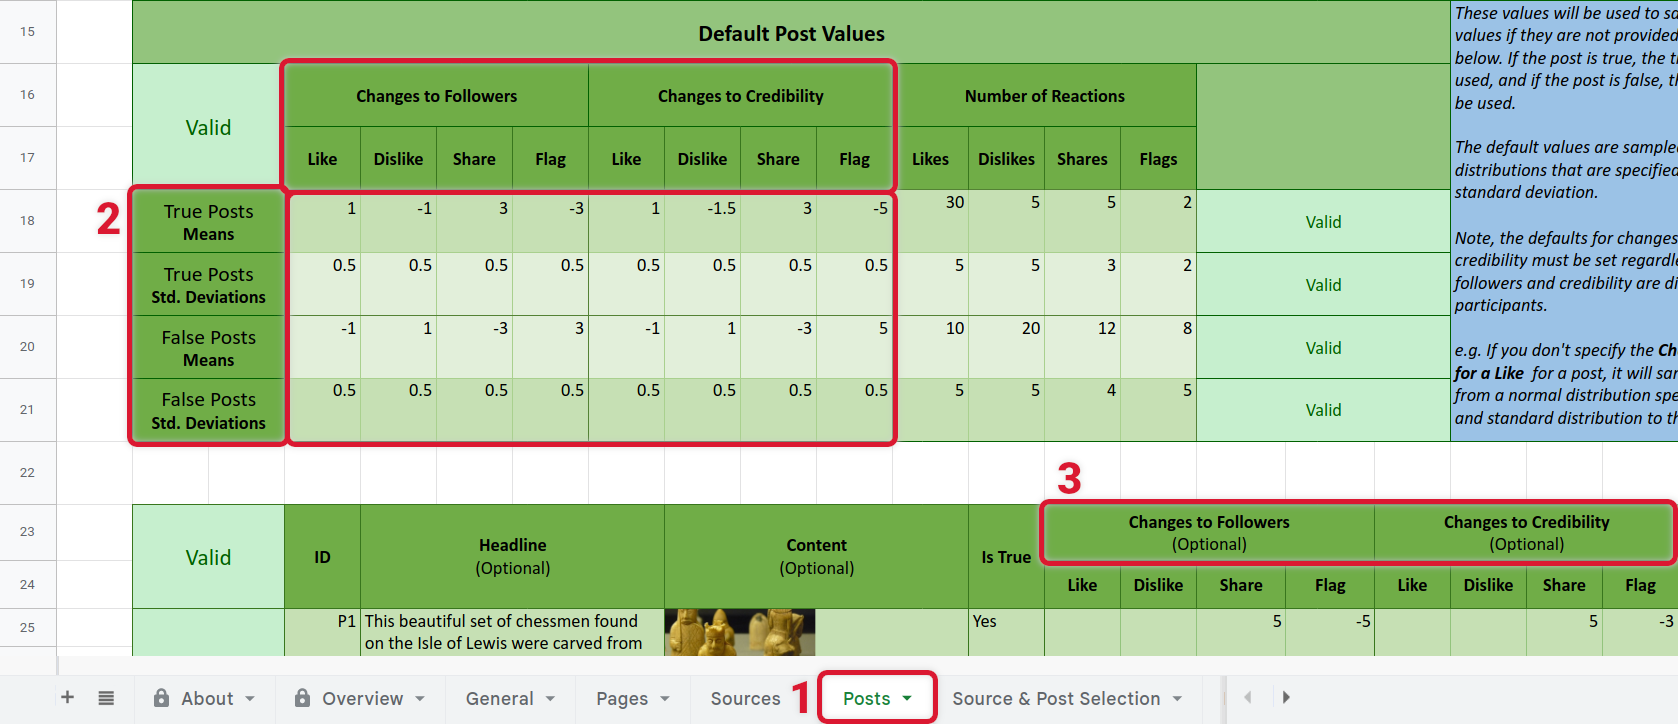
The dynamic feedback is controlled within the Posts sheet, as shown in Figure 9. The default normal distributions are specified for true and false posts separately, with one distribution for each reaction option. The mean and standard deviation of these distributions can be specified under the Default Post Values section at the top of the sheet. Additionally, exact changes to followers and credibility for reactions can be specified for each post individually in the posts table (within the row where post information has been included). Additional documentation about configuring the default post values can be found in the Default Post Values reference, and documentation about configuring the exact changes for a post can be found in the Changes to Followers reference.
2.5. Configure How Sources and Posts are Paired #
The sources that are shown for each post is dynamically selected when each participant starts the study. This can be set in a number of different ways based upon the needs of your study (see the Selection configuration reference). However, if you don’t wish to dive into the details, the “Credibility” mode is a good default pick. It selects true or false posts to pair with a source based on the credibility score of that source. If the source has a high credibility, it will be shown with more true posts, and if the source has a low credibility, it will be shown with more false posts. The likelihood of this pairing can be altered under the Credibility Settings section on the Source and Post Selection sheet. Additionally, if you want more control, then you can also define the pairings of sources and posts manually, by selecting the “Pre-Defined” mode and adding the pairings in the Pre-Defined Source/Post Pairs sheet. Additional detail on the available source/post selection modes can be found in the Simulation documentation.
2.6. Update your Study’s Introduction and Debriefing Pages #
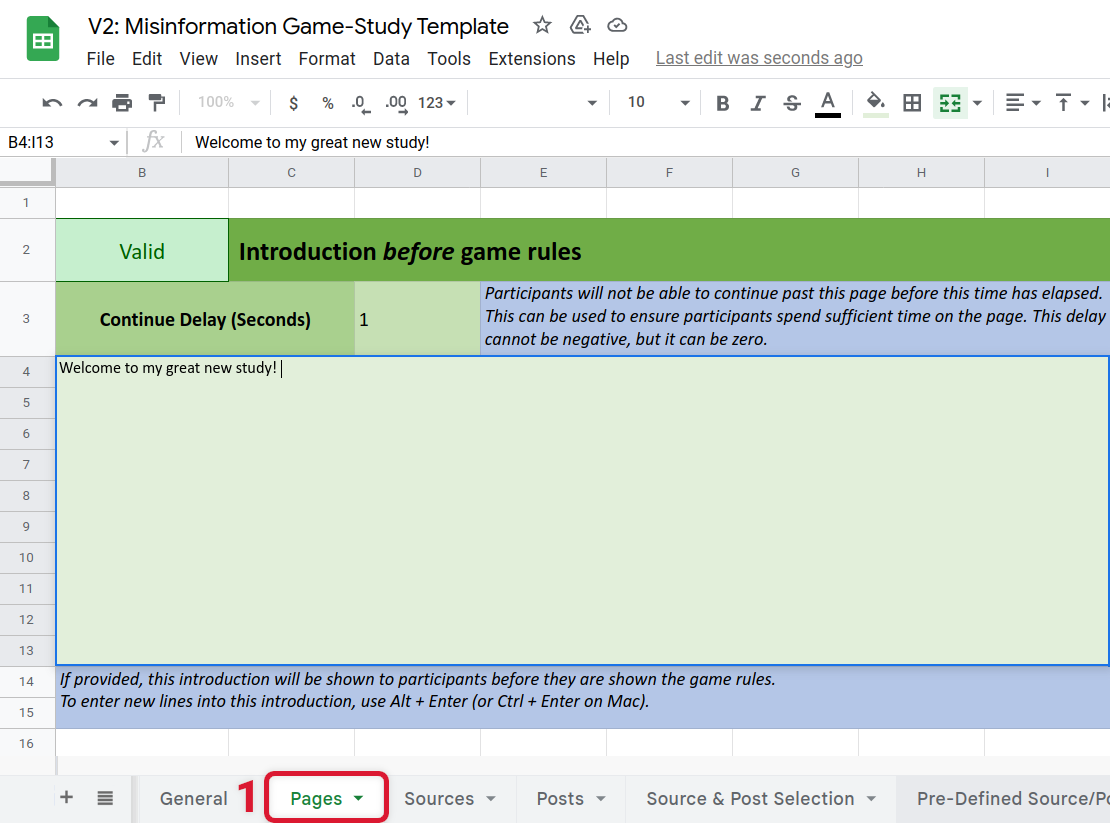
The Misinformation Game supports showing several pages of information to participants before and after they play through a study. The content of these pages can be entered within the Pages sheet, as shown in Figure 10. These pages support formatting using the Google Sheets text editor (e.g., font size, style, or colour), and support the use of HTML for additional control if needed. Additionally, there are several placeholders that may be used to include richer components within pages (e.g., icons or completion codes). The introduction pages may also be disabled by deleting their content. Additional documentation on these pages can be found in the Pages configuration reference.
2.7. Other Considerations #
There are many other small considerations that you should make when configuring your study using the Misinformation Game. Several of the considerations that we consider important are listed below:
-
Select whether you wish your study to be displayed as a feed, or whether only a single post should be shown at a time. This option will have a significant impact on the experience of your participants. See the Display Feed configuration for details.
-
Enter the prompt to display to participants before they start a study. This can be used to test hypotheses about participant’s actions after different prompts, or it can simply be used to encourage your participant’s to have focus during the study. See the Prompt configuration for details.
-
Select whether you wish to enforce participant identification through a text identifier. This is vital if you wish to identify participants as they move from other platforms (e.g., Qualtrics or Prolific). This participant identifier can be provided through URL parameters, as discussed in Accessing the study URL. See the Require Identification configuration for details.
-
Select whether you wish to generate completion codes for participants. These completion codes are only shown to participants after they have completed the study, and they are saved in the results. This can be used to verify that a participant has completed the study, by requiring that they enter the completion code into another platform such as Qualtrics. See the Generate Completion Code configuration for details.
3. Install The Misinformation Game #
You must host your own version of the Misinformation Game to use it for your studies. The installation process can take a few hours, but you only have to follow it once. See the Installation guide for step-by-step instructions.
4. Test your Study #
Once you have deployed your own instance of the Misinformation Game, you may upload your study to test it! See the Upload your Study guide for instructions on downloading, uploading, and testing your study. You may also use the Update Study button to introduce changes to your study, as you fine-tune it for your research.
5. Run your Study! #
When you are happy with your study, you can enable it so that other people can access it. You may then share the URL of your study with your participants, so that they can play through it. If you are using the Firebase free tier, and are expecting a lot of participants, or if your study has many images, you should read the Firebase Pricing documentation to make sure that you don’t hit the free tier’s limits. Additional documentation on the results that are provided by the Misinformation Game are also given in the Results documentation. We hope that the results you gather using the Misinformation Game are valuable!
If you publish your research, we would also really appreciate it if you cited The (Mis)Information Game paper in your work! The BibTex for this citation is included below:
@Article{Butler2023,
title={The (Mis)Information Game: A social media simulator},
url={https://doi.org/10.3758/s13428-023-02153-x},
doi={10.3758/s13428-023-02153-x},
journal={Behavior Research Methods},
issn={1554-3528},
year={2023},
month={Jul},
day={11},
author={Butler, Lucy H. and Lamont, Padraig and Wan, Dean Law Yim and Prike, Toby and Nasim, Mehwish and Walker, Bradley and Fay, Nicolas and Ecker, Ullrich K. H.}
}
6. Learn about Future Updates 🚀 #
We share updates about the Misinformation Game in our Slack channel. If you wish to stay up-to-date, or if you’d like to share what you’re working on in relation to the Misinformation Game, please join our community on Slack!
Back to Top